|
World Class Signal Metering and Analysis

$299 Standard, $549 Complete
view larger image |
SpectraFoo provides all of the tools today's digital projects demand. Whether you are a live sound engineer or a studio mixer, you need the power that Foo provides. Including standards-based level metering, high-speed, high-resolution spectral analysis, the unique Phase Torch, correlation metering, triggerable waveform display, power balancing and a variety of power, envelope and spectral histories and phase analysis on any number of input or output channels, the SpectraFoo range is absolutely essential for broadcast production and critical mixing & mastering.
SpectraFoo is used around the world for analysis in mixing, mastering, acoustic analysis, live audio and electronics.
|
|
By using features like:
- Windowsets: Arrange any combination of analysis instruments however you want, save commonly used combinations and recall them on the fly via menu or keycommand
- Link groups: Selectively link controls of multiple instruments; for example, have all level meters display using the same scaling or control the frequency range of several Spectragraphs with a single slider
- Massively multichannel: Up to 24 independent analysis channels
SpectraFoo allows you to create unique combinations of analysis instruments to fit your needs, whatever they may be. One tool, many uses.
|
SpectraFoo Standard Features
SpectraFoo was designed to provide all of the tools you need for a powerful suite of digital meters, with all of the resolution of hardware meters at a fraction of the price. With more than 15 individual metering tools, SpectraFoo gives you all of the information you need to analyze and prepare your audio, for production, performance, mastering, or broadcast. SpectraFoo was created for live sound engineers, musicians, post-production houses, and broadcast facilities.
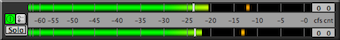
| Digital Level Meter: This three-in-one digital level meter can simultaneously display Peak, RMS, and VU levels. The meter uses color to distinguish the different modes. The Peak and RMS meters each have independent, resettable peak hold functions. The meter also contains a numerical counter that indicates the largest number of consecutive samples surpassing 0dBFS. The calibration of the meters is referenced against 0dBFS. |
 |
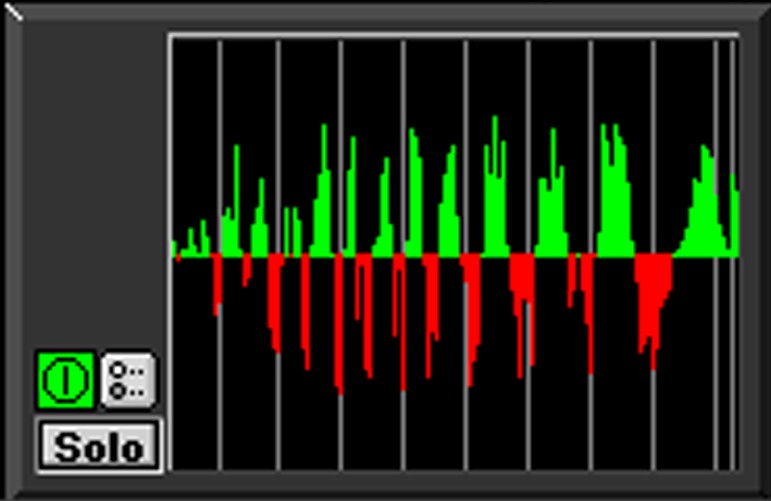
| Peak and RMS Power History: See the history of the information displayed by the Peak and RMS meters. The light grey “tick” marks indicate the passage of one second of time, and the height of the each color for each time “slice” indicates the Peak (yellow) & RMS (purple) power levels of the program. The ratio between these two levels is responsible for the “perceived” volume” of program material. When there is a large difference between the Peak and RMS levels of program material, the perceived volume will be low as compared to the peak levels on the tape. Conversely, when the difference between Peak and RMS levels is small, the perceived volume will be louder. This instrument can help you determine how much compression and limiting is needed for specific program material. |
 |
|
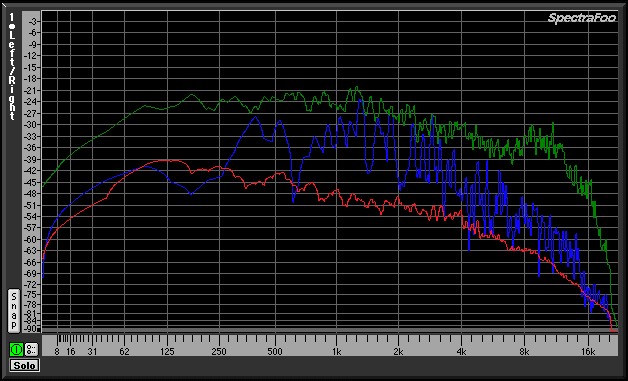
| Spectragraph: See spectral performance with widths as small as 2/3 Hz with Foo's realtime, high resolution spectrum analyzer. SpectraFoo creates a new analysis up to 84 times per second, allowing you to see musical structure even at the highest tempos.
Customizable with Peak, Instantaneous, and Average traces, the Spectragraph is fast enough to create a highly detailed, animated “movie” of sonic events. Visualize your audio with the Spectragraph and see details of your recordings you've never seen before - like phase structure, overall spectral balance, dynamic range, frequency range, and low frequency roll-off.
|
 |
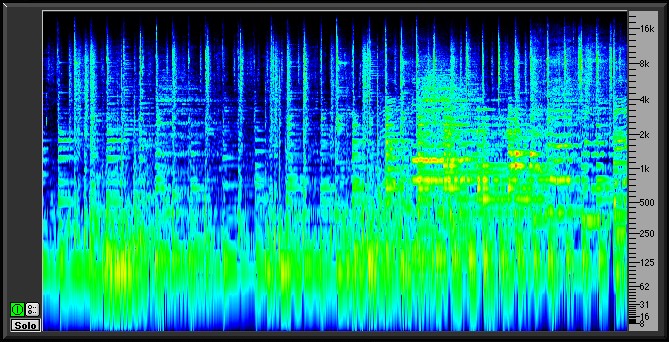
| Spectragram: This Real-Time Spectral Power History Analyzer utilizes the same FFT resolution and scale as the Spectragraph to correlate not only frequency and power, but also time. The result is a visual “sonic fingerprint”. Like the Spectragraph, the true power of this instrument lies in its synchronization with the live audio signal. After spending some time “calibrating your eyes to your ears” by watching the Spectragram while listening to music, the instrument literally becomes a waterfall of musical information.
This tool is very effective for precisely identifying frequency overlap and masking effects, such as a bass drum track and a bass track occupying the same frequency range and obscuring each other. It gives you a good picture of the rhythmic aspects of program material and is very helpful in pinpointing timing problems in dense arrangements. The Spectragram represents the power of frequency events through a color scale.
|
 |
| Power Balance History: Compare the power balance between the two input channels as a function of time. The Power Balance History meter is very helpful for precisely identifying the aspects of mixes that don’t have a natural flow of energy between the left and right channels. It is also great for power-balancing natural stereo recordings and two channel measurements of equipment. |
 |
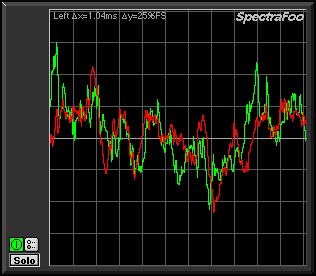
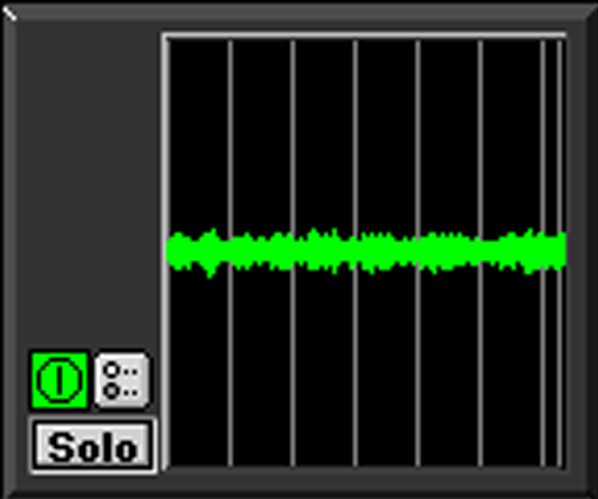
Triggering Oscilloscope: See the wave shape characteristics of very low level signals with the full featured oscilloscope. The oscilloscope can trigger and hold the wave form of the signal being monitored. There are are seven available trigger modes:
- Free: automatically retriggers on the internal clock;
- Normal: triggers the drawing trace once channel input matches your trigger settings
- Hold: triggers a drawing trace and holds the signal until rearmed
- Hold and Retrigger: same as Hold, but the trigger is automatically rearmed
- Timed Hold: same as Hold, but the trigger is automatically rearmed after the desired
"retrigger time"
- Polarity Check: same as Hold, but displays all the data prior to the trigger point and triggers
on either polarity and either slope
- Timed Polarity Check: rearms after the desired "retrigger time"
- Clip Capture: same as Polarity Check but triggers when signal reaches full scale
- Timed Clip: Capture rearms after the desired "retrigger time"
|
 |
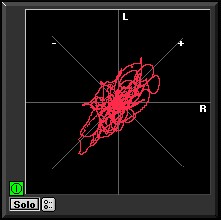
| Lissajous Phase Scope: The Lissajous Phase Scope shows you the amplitude of the first input signal versus the amplitude of the second input signal. This instantly lets you know if a mix has polarity problems and allows you to see the width of the stereo field of the material being monitored. |
 |
|
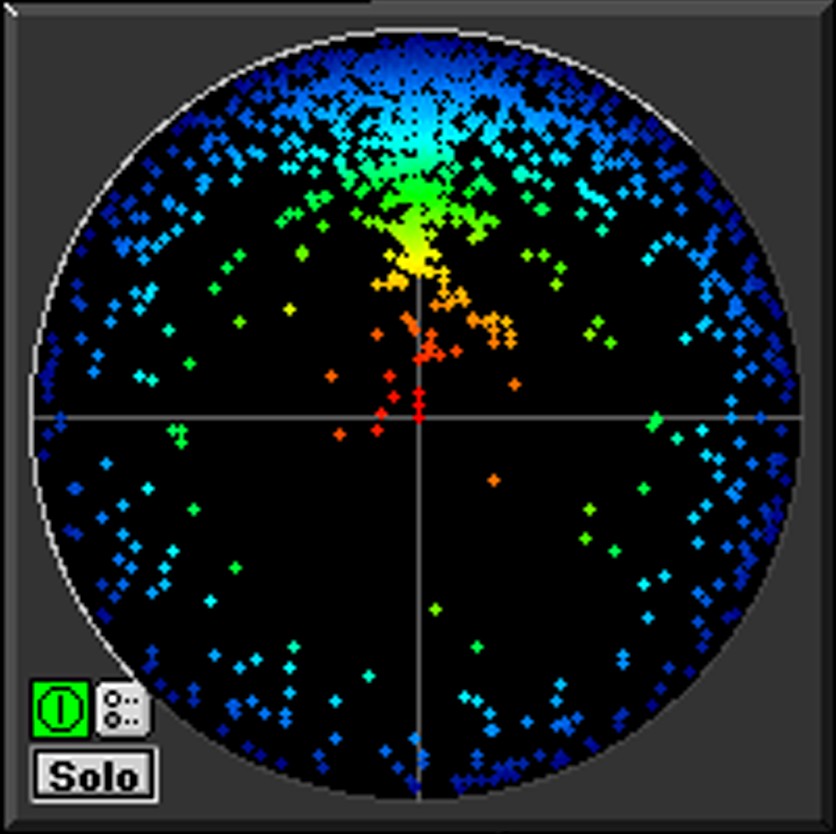
| Phase Torch: This revolutionary tool compares the phase difference between two channels as a function of frequency, independent of power. The radius from the center is determined by the frequency and the angle is determined by the phase difference between the left and right channels. The center of the graph represents DC while the outer radius represents 22 kHz . In order to help you intuitively identify the frequencies, the phase points are also colored according to their frequency. A mono (in-phase) signal is indicated by what looks like a torch precisely aligned with the Y axis of the scope. An out-of-phase signal appears as a negative version of a mono signal. Delays appear as spirals within the scope. This meter is very useful when recording a musical instrument with multiple microphones to identify the frequency ranges in which phase cancellations are occurring as a result of the comb filter created by the use of multiple mics on a single source.
The Phase Torch can also be used as a very quick and elegant troubleshooting tool for identifying phase anomalies in studio wiring, and a number of other applications including:
• Setting azimuth on analog tape recorders
• Checking for time alignment in complex PA systems
• Frequency sensitive mono compatibility analysis
• Identifying frequency dependent phase and polarity problems (such as an out of polarity high frequency driver in a sound reinforcement system).
|
 |
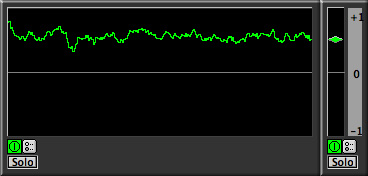
| Correlation Meter and History: The Correlation Meter reduces the relative phase information between two channels to a number between -1 and 1.The centerline corresponds to a correlation of 0 while the top edge corresponds to +1 and the bottom to -1. Dock the Correlation Meter to the left side of the History Meter and provide both instantaneous and historical data in one composite instrument.
The Correlation History provides you with a time history of the correlation meter. See how the phase correlation evolves over time and track down specific problems while you're listening to the events. If the correlation dips every time the snare drum hits, it is very likely that the channels that contain the snare are causing the problem.
|
 |
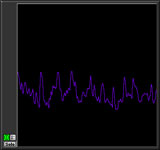
| Band Power History: This instrument allows you to see the history of the amount of power in a specified band of the spectrum. Just set the center frequency and the bandwidth of the power band that you are interested in monitoring, down to 1/12 of an octave at 6kHz and use the Band Power History tool as a very effective sibilance meter. |
 |
| Envelope History: Calibrate your eyes with this sample-editor style scrolling envelope overview. The Envelope History tool is useful for identifying large level changes when the average level is high. It should be used in conjunction with the Peak and Average History display to obtain a good view of the overall dynamics of program material. |
 |
SpectraFoo Complete Features
SpectraFoo has been designed to provide all of the tools you need for a powerful suite of digital meters, with all of the resolution of hardware meters at a fraction of the price. With more than 15 individual metering tools, SpectraFoo gives you all of the information you need to analyze and prepare your audio, for production, performance, mastering, or broadcast.
SpectraFoo Complete was created for live sound engineers and mixing engineers. Including tools to measure your acoustic environment or verify the behavior of your external digital devices, SpectraFoo Complete provides the following additions to SpectraFoo:
| Full featured world-class signal generator:SpectraFoo Complete has a high-resolution multi-tone, multi-noise, sweepable, burstable signal generator. The generator is capable of running in real-time, or alternatively striping signal into a capture or into an AIFF or SDII file. The interface to the signal generator is numerical, which makes it very precise,
• Provides high resolution 24-bit distortion free signal generation
• Up to 9 simultaneous sine sweeps
• Pink and White noise generation
• Burst Generation
• FFT synchronized sine generation
• Direct generation to audio I/O, captures and files
|
 |
| Transfer Function Measurement System: For live sound, equipment testing, or any application where you need to analyze the characteristics of acoustical and electrical audio systems, SpectraFoo Complete's built in transfer function display shows you the relative power and phase response between the left and right channels. Using Metric Halo's Music Based Measurementô, the source signal is the input to some audio processing arrangement and the response signal is the measured output of the system, making music your “test tone”. SpectraFoo uses the source signal as a point of reference and the transfer function display shows the differences in amplitude and phase between the source and response as function of frequency.
This allows you to measure the properties of audio processing systems, including systems that contain acoustic elements. You can determine the amplitude and phase response of an equalizer in the presence of musical signal as easily as measuring the sound coloration of an acoustic space.
SpectraFoo provides a Delay Detection Feature to properly measure the power and phase of the response signal relative to the source signal, as the source signal must be delayed to time-align it with the response signal. The delay finder records a segment of both signals and computes the correlation of the signals with each other. By moving the cursor to the largest correlation of the two signals, you set the system delay and compensate for the measurement delay, time-aligning the two signals.
|
 |
Capture and Static Analysis system: Allows you to record directly into SpectraFoo's RAM based capture system
• Provides loop playback
• Allows you to open sound files for detailed analysis
Record selections of audio into the computer’s RAM and perform incredibly detailed non-realtime analysis. All captures are referenced to the timecode of the source material. Captures may be initiated manually or can be triggered automatically, either with a level-based trigger or a time-based trigger. All recording is controlled and initiated by three basic capture modes that you may use:
1. Manual
Use manual mode to record on the fly. Click the record button to start recording and click it again to stop recording.
2. Timecode-based auto-punch
Use timecode-based auto-punch to record a segment of audio that starts at a particular time and ends at another time. This is like the auto- punch feature of many tape decks. Simply type the start and end times into the punch in and punch out fields and click the Record button. SpectraFoo will arm its auto-punch mechanism and wait until the timecode clock matches the punch-in time. It will then record until the timecode clock matches the punch-out time, and automatically stop.
3. Level-based auto-punch.
Use level-based auto-punch to start and stop recording based on the volume of the audio being monitored.This is great for capturing individual drum beats or for capturing entire songs. A specific example of the usefulness of level-based captures is when you are trying to determine the optimal placement of microphones on a drum kit. When coupled with the Auto Arm feature, level-based punches can be used to capture individual drum beats in a hands-free way, allowing you to devote your attention to placing the mic, while still benefiting from SpectraFoo’s analysis.
|
 |
|
When Data Slicing is enabled, the realtime instruments display the data which lies underneath the current position of the cursor. If you drag the cursor around in the overview window, the realtime instruments will continuously update to reflect the current cursor position. If you replay the capture, the realtime rack will continuously update in sync with the playback.
|
 |
Code-Level Metering:
Three different kinds of bit meters for monitoring the low level audio bitstreams: |
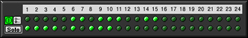
| Bit Range Meter: Displays the range of sample codes exercised in the assigned channel of each time slice. It shows the activity in each bit of the sample word and shows you which bits are being exercised. |
 |
| Bit Scope: Displays a list of the codes of all of the samples in the time slice. This allows you to see low-level activity in the signal, stuck bits, DC offsets and the like.
Each time the display is updated, all of the sample in the time slice are shown. The number of samples in the time slice are determined by the I/O hardware’s buffer size. The samples are displayed starting with the first sample in the time-slice in the upper left hand corner of the instrument. Each successive sample is place under the previous one until the bottom of the column is reached. The next sample is placed at the top of the next column.
|
 |
|
| Bit Matrix Meter (Instantaneous Snapshot):Pinpoint problems with processing algorithms in your data stream, and test and design DSP algorithms with this comprehensive readout.
The Bit Matrix Meter is designed to work with 16-bit delivery media and only utilizes the top 16 bits of the samples in the signal. The meter takes the 16-bit samples and divides them into two groups: the most significant byte (MSB) which is the top 8 bits, and the least significant byte (LSB) which is the bottom 8 bits. For each sample these groups are then converted to horizontal (MSB) and vertical (LSB) offsets into a 256x256 pixel matrix.
|
 |
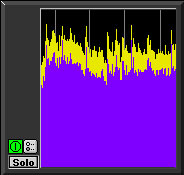
| Bit Matrix Meter (Accumulation Snapshot): Switch the Bit Matrix Meter into Accumulation Mode and display the aggregate utilization of the code space. The accumulation mode does not erase the bit matrix with each new time-slice and this accumulates a picture of all of the sample code that have been exercised by the signal. This snapshot shows us that while most of the codespace is exercised by the signal, the top 3dB or so is pretty sparse. This indicates that we could compress this signal with a pretty hard ratio and a 3dB threshold and introduce very little distortion. |
 |
|
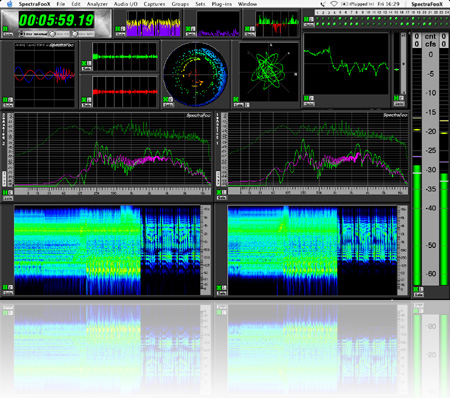
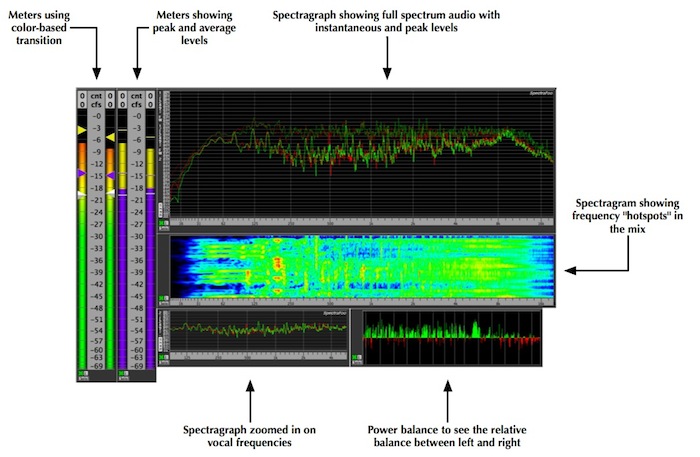
Here's a typical windowset for using SpectraFoo to tweak a mix, featuring:
- Two meters showing different views of the same audio
- Spectragraph and Spectragram using link groups to ensure that the frequency and power scaling of the displays is in sync
- Independently scaled Spectragraph
- Power balance
|
|
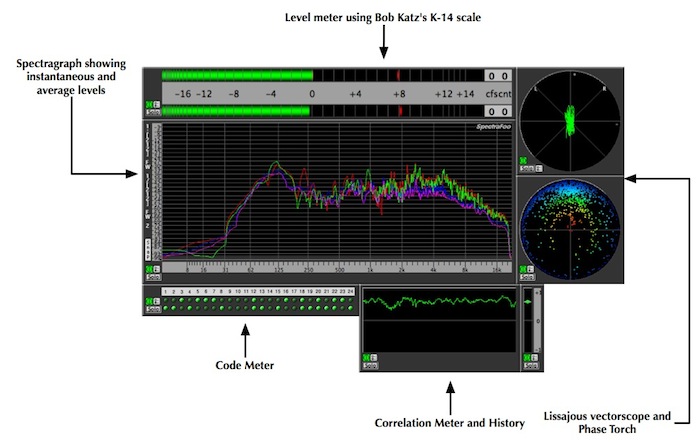
Here's a typical windowset for using SpectraFoo to master a mix, featuring:
- Level meter using the K-Metering scale for accurate monitoring dynamic range
- Spectragraph showing instant vs. average levels
- Phase analysis
- Correlation analysis
- Detailed bit-level display
|
|
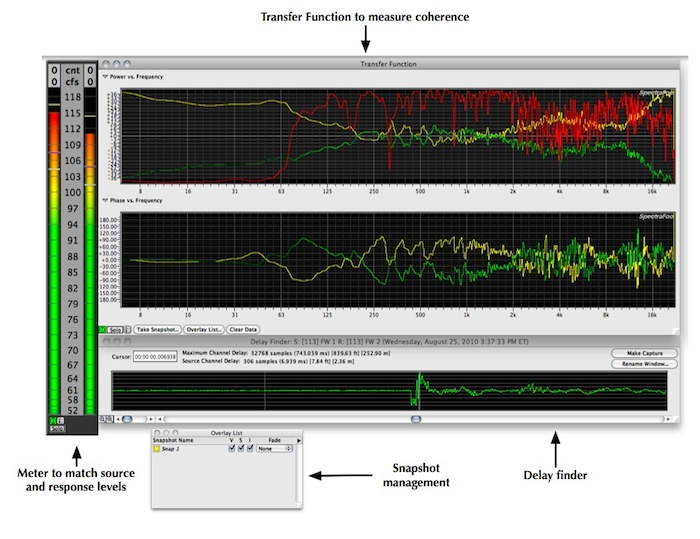
SpectraFoo Complete configured for room tuning with:
- Level meter to match source and response levels
- Transfer Function to analyze the coherence of the room, with inverted snapshot to facilitate EQ'ing
- Delay finder for setting delay times for a multispeaker audio system
- Snapshot management window
|
|
|
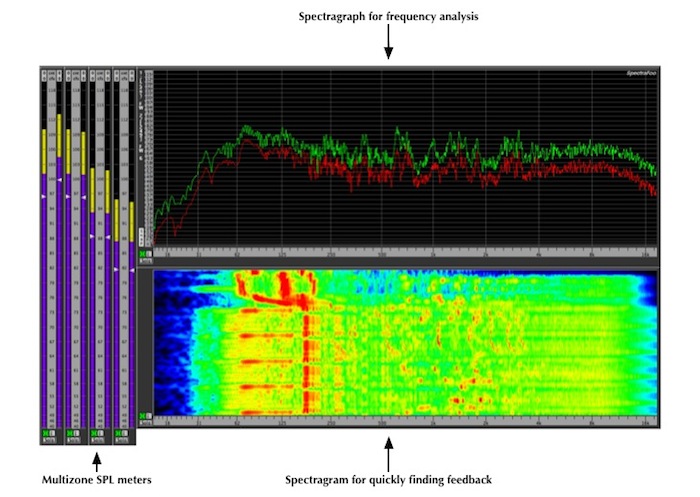
This windowset configures SpectraFoo for multizone PA tuning with:
- Multiple level meters calibrated for SPL
- Spectragraph for instant frequency analysis
- Spectragram for long decay frequency display- great for zeroing in on feedback
|
|
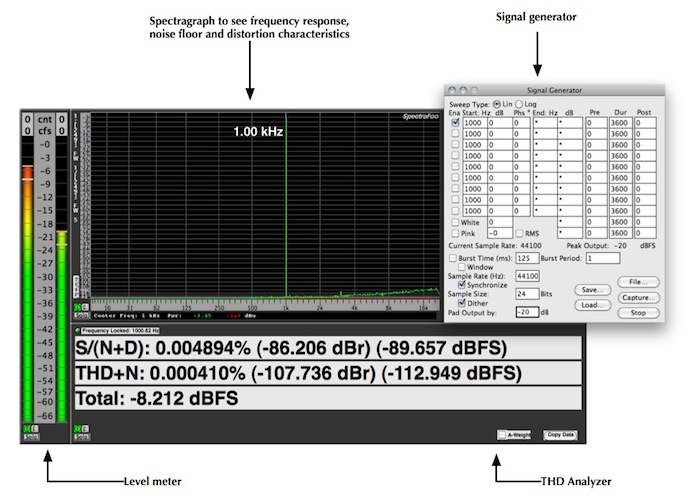
SpectraFoo can easily be used to test gear directly. Here we are using:
- Level meters
- Spectragram
- Signal generator
- THD Analyzer to show signal to noise and distortion
Every Metric Halo interface is tested with SpectraFoo!
|
|
To learn more about SpectraFoo in detail, you can:
Download the manual (22 Mb PDF)
Read the technotes:
| Technote # |
Title |
Focus |
Author |
Version |
Date |
| 0003 |
Multizone Measurement with SpectraFoo |
SpectraFoo |
Allen Rowand |
1.2 |
July 2, 2010 |
| 0009 |
Routing into SpectraFoo from your DAW |
MIO 2d Expanded |
Allen Rowand |
1.0 |
December 10, 2009 |
Watch the tutorial videos:
|
|
|


